I like taxpayers who are engaged and ask tough questions. For example, Amherstburg Accountability Project contributor Terence Greshum says let's compare debt:

I did some homework on debt. (You can rely on me to do that). The following information is based on the Financial Information Reports filed each year by every Ontario municipality as required by provincial legislation. Here is how Essex County municipalities compare in debt, as of December 31, 2018.
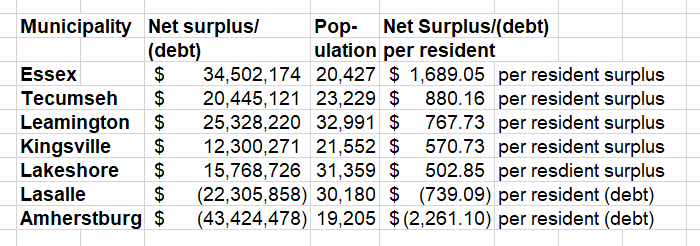
As you can see from the chart above, the municipality of Essex is in the best overall position. Essex has no net debt, and a net surplus of $34,502,174 in the bank. Amherstburg is in the worst overall position with $43,424,478 of net debt.
When comparing net debt per resident, Essex is still in the best position with no net debt, and a net surplus of $1,689.05 per resident. Amherstburg is still in the worst position with $2,261.10 of net debt per resident.
I want to stress that the surplus/(debt) numbers and the population numbers come directly from the annual Financial Information Report filed each year by the municipalities. They are posted by the Ministry of Municipal Affairs.
It is also worth noting that there is a spread of almost $78 million between the best place municipality (Essex) and the worst place municipality (Amherstburg).
Thank-you Terence Greshum for your question.